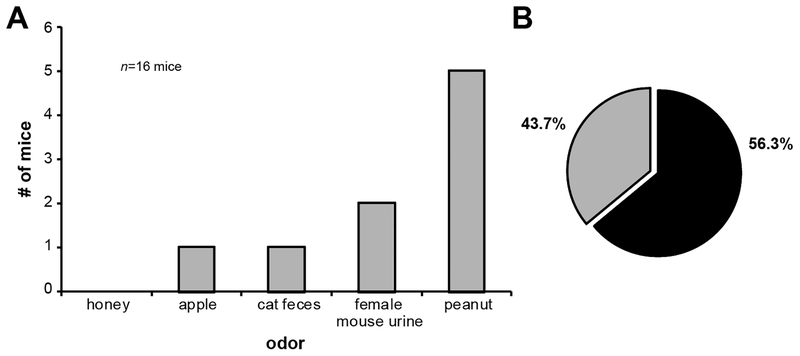
Figure 8. Most mice display stable preferences for ethologically relevant odors from day-to-day.
(A) Histogram illustrating the number of mice which ‘preferred’ the same odor across 3 or more of the 5 testing days (viz., displayed a stable odor-specific preference). No mice displayed stable odor-specific preferences for honey in this analysis. (B) Pie chart displaying the % of all mice which displayed stable odor specific preferences (black = mice with stable preferences, gray = mice which did not).

