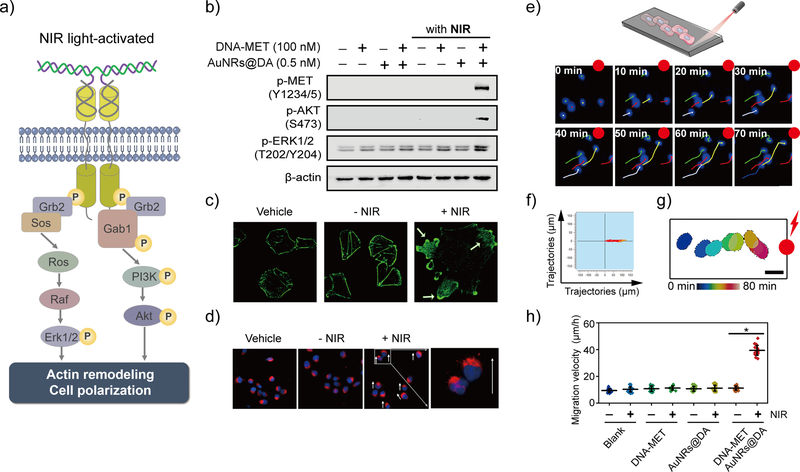
Figure 2. NIR light-activated MET signaling and cellular responses.
(a) Scheme illustration of NIR light-induced MET dimerization and downstream signaling. (b) Activation of MET signaling triggered by NIR light on A549 cells was investigated by western blot analysis. (c) NIR light-induced actin-cytoskeletal remodeling. The DNA-MET chimeric receptors (100 nM) modified A549 cells were incubated with AuNRs@DA (0.5 nM) and were treated without or with 4-min NIR light-irradiation, then were incubated at 37 °C for 1 hour followed by fixation and staining with FITC-phalloidin. (d) NIR light-directed cell polarization. DU145 cells were pre-modified with DNA-MET chimeric receptors and then incubated with AuNRs@DA. The opposite terminal of the µ-slide was irradiated with laser 808 nm for 4 min and was incubated at 37 °C for 30 min. The cells were fixed and stained using the fluorescent probe for Golgi (red) and nuclei (blue); the white arrow indicates the moving direction. (e) Upper: scheme illustration of NIR light-activated directional migration using ibidi μ-slide, lower: NIR light-induced directed migration of cells population. The cell movement was tracked under fluorescence microscopy, the migration trajectories of the cell were segmented from fluorescence images every 10 min. The scale bar: 10 μm. (f) Directional migration trajectories of cells. The DU145 cells were treated with DNA-MET chimeric receptors and AuNRs@DA, and the opposite terminal of the µ-slide was irradiated with NIR laser 808 nm for 4 min. The migration trajectories of cells (n=10) were illustrated. (g) Time-dependent tracking of the single cell toward the NIR light. The cell movement was tracked under fluorescence microscopy, the outer border of the cell was segmented from fluorescence images every 10 min, and the contours of the cell are illustrated for increasing time points (from blue to red) over 70 min. Scale bar: 20 μm. (h). Moving velocities of cells induced by NIR light (n=20). The average velocity of directional migration of DU145 cells during the duration (2.5 h) was quantified and analyzed. Data are represented as means ± SD, *P<0.05.

