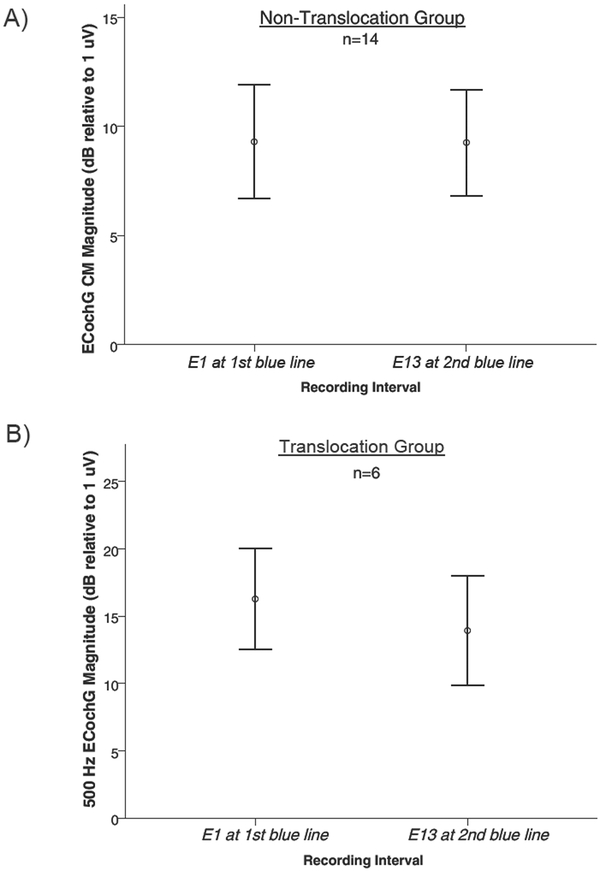
Figure 3:
A) Magnitude of the ECochG response following a 500 Hz tone burst at two recording intervals: “first blue line” and “electrode 13” for those without a translocation (ST) Note: Error bars represent +/− 1 standard error of the mean, circles and squares represent mean magnitude for each group. B) Magnitude of the ECochG response following a 500 Hz tone burst at two recording intervals: “first blue line” and “electrode 13” for, those with a translocation (SV). Note: Error bars represent +/− 1 standard error of the mean, circles and squares represent mean magnitude for each group.

