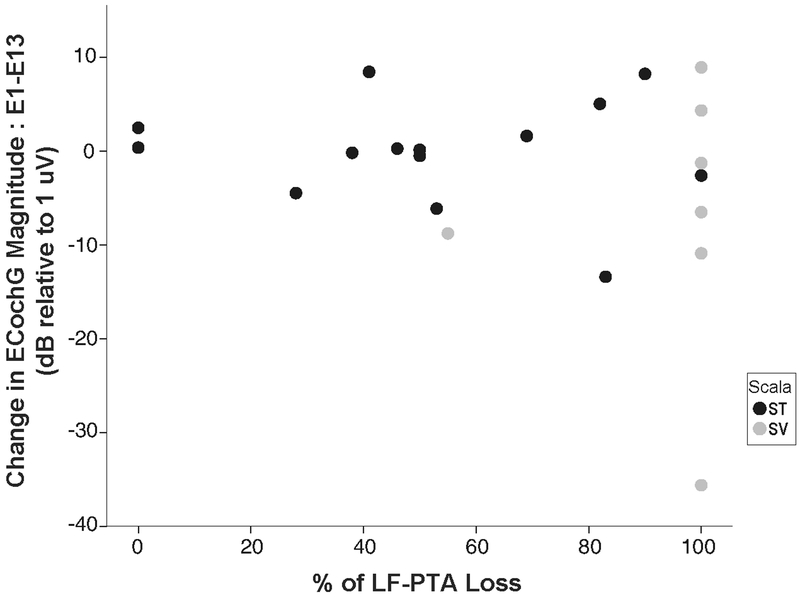
Figure 4:
The difference in the ECochG magnitudes at the two recording intervals (E1-E13) plotted as a function with the change in low frequency-pure tone average (LF-PTA) percentage from pre- to post-surgery. The black circles represent the patients of the group without a translocation and the gray circles represent the patients in the group with a translocation

