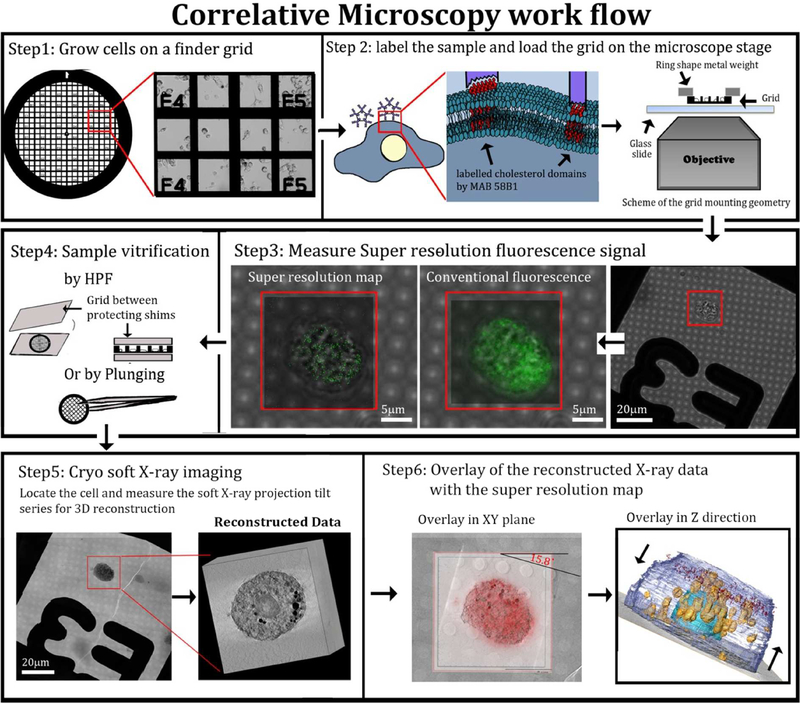
Figure 4:
Correlative microscopy flow-chart. Step1: Cells were grown on gold finder grids with fiducial markers that allow navigation to desired locations on the grid. The cells were incubated for 48 h with acLDL. Step2: Cells were fixed (4 % PFA, 0.1% GTA, see methods) and incubated with primary and secondary antibodies. Step 3: super-resolution fluorescence signal was resolved by STORM. Step4: Grids were high pressure frozen. Step5: X-ray tomograms were taken of the same cells that were analyzed by STORM. Data were reconstructed (field of view 15 μm3). Step6: Overlay of the data was done manually using the grid mesh as fiducial markers for the xy plane. For the z plane, each of the X-ray and fluorescence volume stacks was divided into layers of 80 nm and overlaid (see experimental section).

