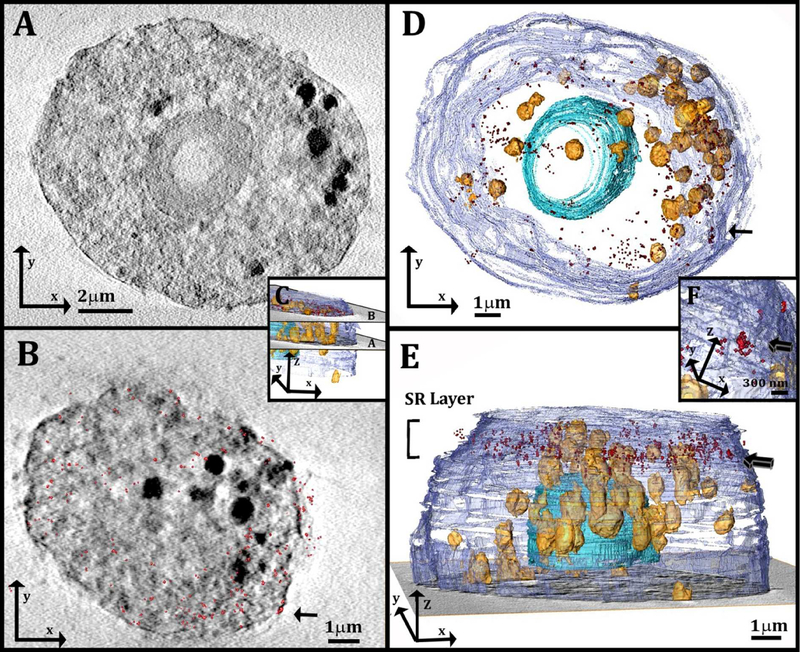
Figure 5:
(A, B): Slices through the 3D reconstruction of a soft X-ray tomogram of a cell after incubation with acLDL. The localization map of the resolved super-resolution image (red spots, 180 nm in depth) is superimposed on the corresponding X-ray data slice in (B). (C): 3D reconstruction of the cell in A, B, showing the location of the slices in (A) and (B): The slice in (A) comes from the middle part of the cell and the slice in (B) comes from the upper part of the cell, where STORM was performed. (D, E): 3D reconstruction of the same cell from a top view (D) and a side view (E). The localization map of the corresponding resolved super-resolution image (red spots) is 1μm in thickness and is located on the upper part of the cell, above the nucleus. Arrow indicates cluster of STORM signals that is magnified in (F). (F): High magnification of a well-defined cluster of the STORM signal (arrow). The cluster was detected on the plasma membrane envelope, and is presented also in (B) and (D) from different orientations (arrows). Segmentation based on contrast was used for the 3D reconstruction. The different features are described using arbitrary colors: plasma membrane (purple) lipid objects (yellow-orange) and cell nucleus (blue).

