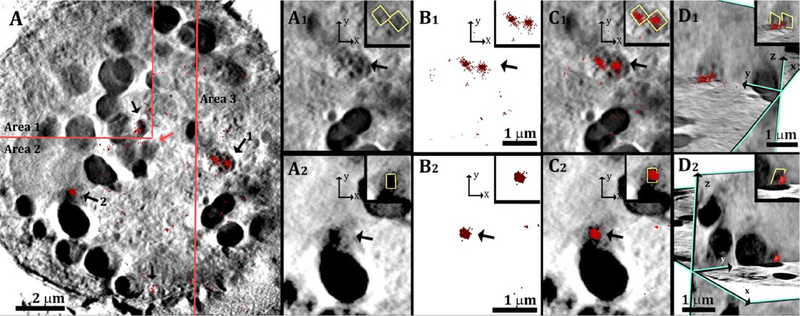
Figure 7:
(A) Slices through the 3D reconstruction of a soft X-ray tomogram of a cell after incubation with acLDL. The cell slice is a mosaic composed of area 1, area 2 and area 3 that were taken at different z inside the cell, to match the locations of the labelled features (arrows). The localization map of the resolved super-resolution image (red spots 360 nm in depth) is superimposed on the corresponding X-ray data slice. (A1, A2): Magnified areas of two features labelled 1, 2, respectively, inside the cell from a top view (xy plane). (B1, B2): Corresponding super resolution fluorescence data. (C1, C2): Superimposition of the X-ray data in A1, A2 with the super-resolution fluorescence data in B1, B2. (D1,D2): Side orientations of the superimposed data presented in C1, C2, combined with perpendicular slices in the zy plane. The inset in each reconstructed picture show the high contrast feature marked in yellow for clearer visualization. This was done manually, based on the contrast the feature. The inset in D2 is enlarged by 30%.

