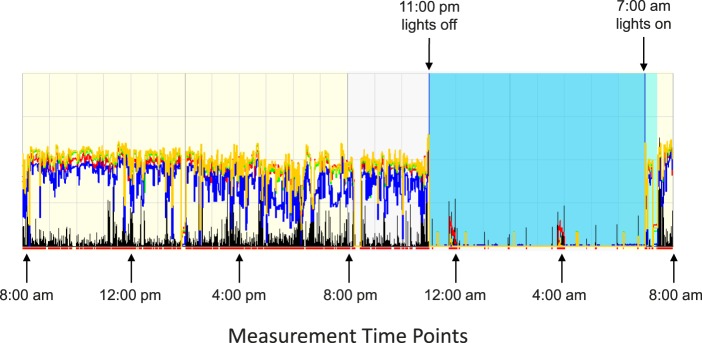
Figure 1.
Actigraph trace for a representative subject for the 24-hour experimental period in lab. Measurements took place every 4 hours beginning at 8:00 AM; black trace represents physical activity, yellow trace represents broadband light exposure, blue, red, and green traces represent the spectral components of light exposure, and the blue region represents lights off (11:00 PM–7:00 AM).

