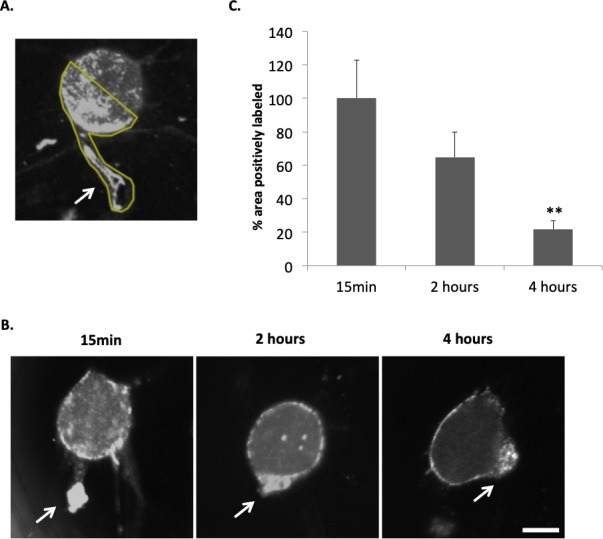
Figure 4.

The barbed end assay demonstrates changes in free barbed ends of actin filaments in rod photoreceptor terminals after retinal detachment and dissociation. (A) Rod cells were imaged with confocal microscopy. The free barbed ends were bound with biotin-actin subunits and labeled with anti-biotin Alexa 488 antibody. The region of interest (ROI) for each rod cell used for quantification of fluorescence is outlined in yellow and includes the terminal, axon if present, and the basal most portion of the nuclear pole to which the axon terminal retracts. Arrow points to the presynaptic terminal. (B) Examples of the barbed end signal in rod photoreceptors after 15 minutes, 2 and 4 hours in culture (approximately 1, 3, and 5 hours after detachment). Arrows, presynaptic terminals. (C) Quantification of fluorescent signal for F-actin barbed ends. Percentage area of total ROI with positive labeling for F-actin barbed ends was measured and normalized (control group set at 100%). Signal in basal (axonal) region of rod cells appeared highest at 15 minutes of culture (set arbitrarily at 100%) and decreased significantly by 4 hours. Optical sections, 1 μm. Scale bar: 10 μm. n = 3 animals, 9 culture dishes, 60 rod cells; 1-way ANOVA, **P < 0.01.
