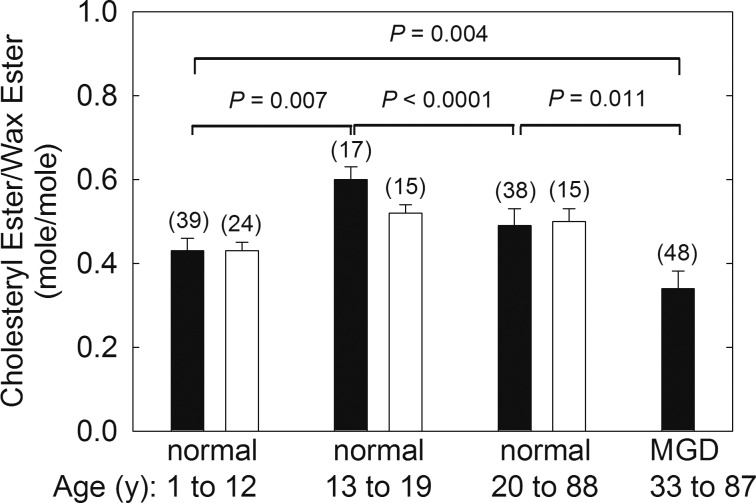
Figure 2.
CE/WE molar ratios calculated from the NMR spectra of meibum. (Solid bar) Molar ratios calculated from the intensity of the CE resonance at 4.6 ppm and the WE resonance at 4.0 ppm. Correcting for (O)-acylated ω-hydroxy fatty acids, the solid bars would be lower. For instance, the value for MGD corrected would be 31, lower than the reported value of 34. (Open bar) Molar ratios calculated from the intensity of the CE resonances from cholesteryl numbers C18 and 19 and the WE resonance at 4.0 ppm. See Figure 1 for details.

