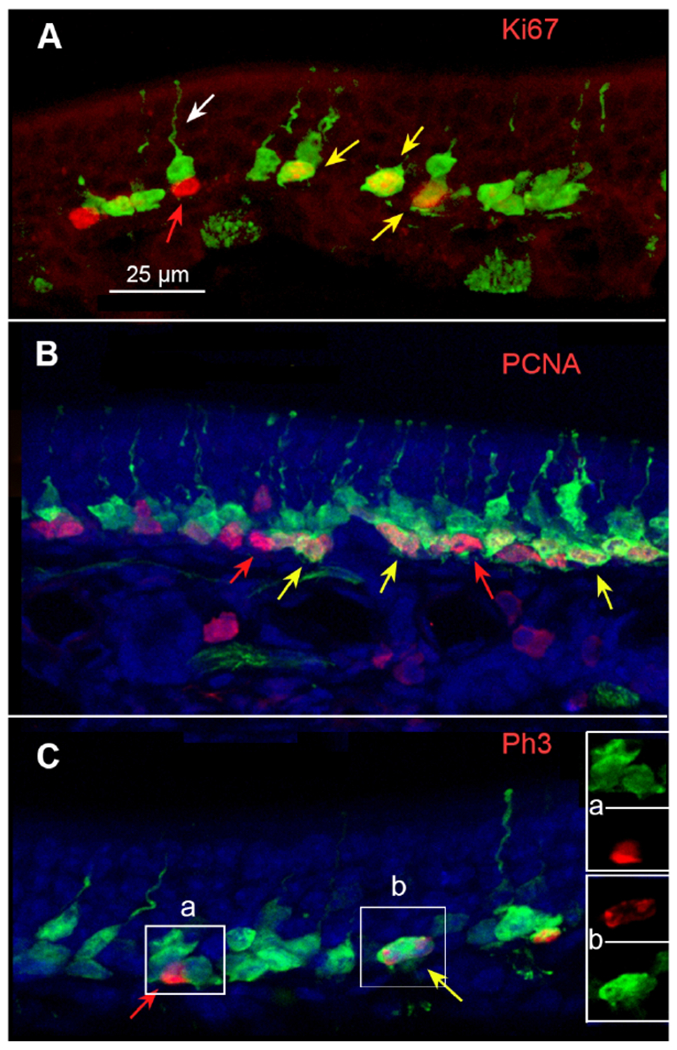
Fig. 5.

Double immunofluorescence for GFP and markers of proliferation. A. Ki67 (red) co-localizes with GFP label in many cells (yellow arrows) although many GFP labeled cells do not exhibit Ki67 label (e.g. white arrow) and some Ki67-positive cells show no apparent GFP (red arrow). Z-stack = 3.9μm. B. PCNA gives a similar pattern of staining to Ki67 showing single labeled cells of each type as well as numerous double-labeled cells. Z-stack = 8.25 μm. C. Double label for 5-HT3AGFP and Ph3. Red and yellow arrows indicate cells single labeled (Ph3 only; red) and double-labeled (Ph3 and GFP; yellow arrow). Inserts A & B show color separation images of areas indicated on the main figure. Z-stack = 6 μm.
