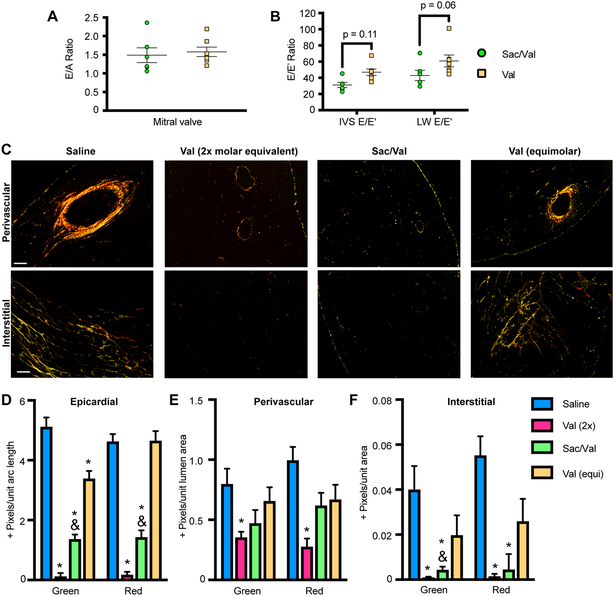
Figure 2: SAC/VAL treatment more effectively reduces cardiac fibrosis in response to pressure overload than equimolar valsartan.
A. E/A ratio is not statistically distinct between SAC/VAL- and valsartan-treated animals (28 days post-TAC). n = 12, 14. Student’s unpaired t-test with Welch’s correction. B. E/E’ ratio (measured at mitral valve and intraventricular septum), trends lower (IVS: p = 0.11, MV: p = 0.06) in SAC/VAL-treated animals as compared to equimolar valsartan-treated animals. n = 12, 14. Student’s unpaired t-test with Welch’s correction. C. Heart sections were stained with PicroSirius Red and imaged with polarized light to visualize the deposition of fibrotic extracellular matrix. SAC/VAL significantly ameliorates fibrosis relative to saline, while the equivalent dose of valsartan does not. Scale bar = 200 μm D-F. Quantification of fibrosis in the epicardial, perivascular, and interstitial areas. Both green (thin/new) and red (thick/established) fibers were analyzed. n = 5, 5, 6, 7. Two-way ANOVA (independent variables green/new and red/established) with Tukey’s multiple comparisons test. * = p < 0.05 compared to saline; & = p < 0.05 for SAC/VAL compared to equimolar valsartan.

