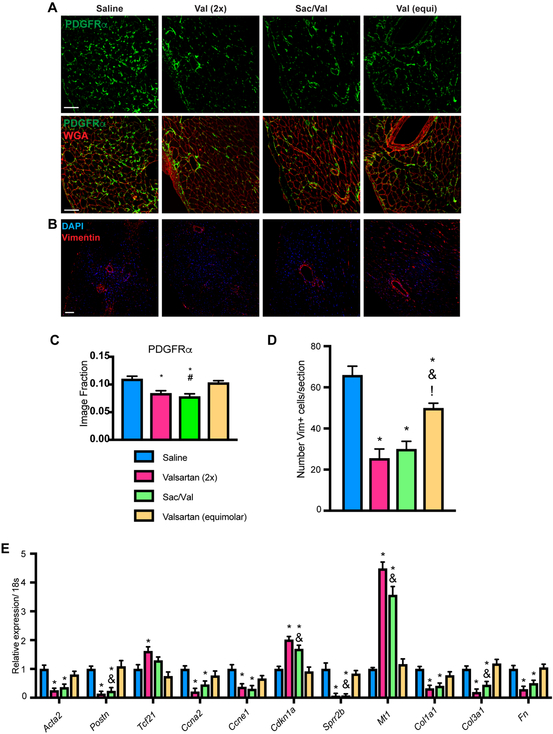
Figure 3: SAC/VAL attenuates accumulation of vimentin+ and PDGFRα+ cell populations, and isolated CF from SAC/VAL-treated hearts show significantly altered gene expression.
A. Staining for PDGFRα and WGA reveals that SAC/VAL significantly decreases CF load post-pressure overload relative to equimolar valsartan. Scale bar = 50μm. B. Sections stained for vimentin revealed that DAPI+/vimentin+ cell population expansion is significantly prevented by SAC/VAL as well as the equivalent dose of valsartan. Scale bar = 100 μm. B. Quantification of PDGFRα staining. One-way ANOVA with Tukey’s multiple comparisons test. * = p < 0.05 compared to saline; & = p < 0.05 for SAC/VAL compared to equimolar valsartan. D. Quantification of vimentin staining, which confirms that while equimolar valsartan decreases fibroblast number, SAC/VAL is significantly more effective. n = 5, 5, 6, 7. One-way ANOVA with Tukey’s multiple comparisons test. * = p < 0.05 compared to saline; & = p < 0.05 for SAC/VAL compared to equimolar valsartan. E. qRT-PCR for gene expression in fibroblasts isolated by Langendorff perfusion of mouse hearts reveals that SAC/VAL effectively targets proliferation, activation, and extracellular matrix-associated gene expression. The equivalent dose of valsartan has no statistically significant effect on any of these genes, while SAC/VAL confers significant changes that reflect a less pathologic gene program. n = 5, 5, 6, 7. Two-way ANOVA, Tukey’s multiple comparisons test. * = p < 0.05 compared to saline; & = p < 0.05 for SAC/VAL compared to equimolar valsartan.

