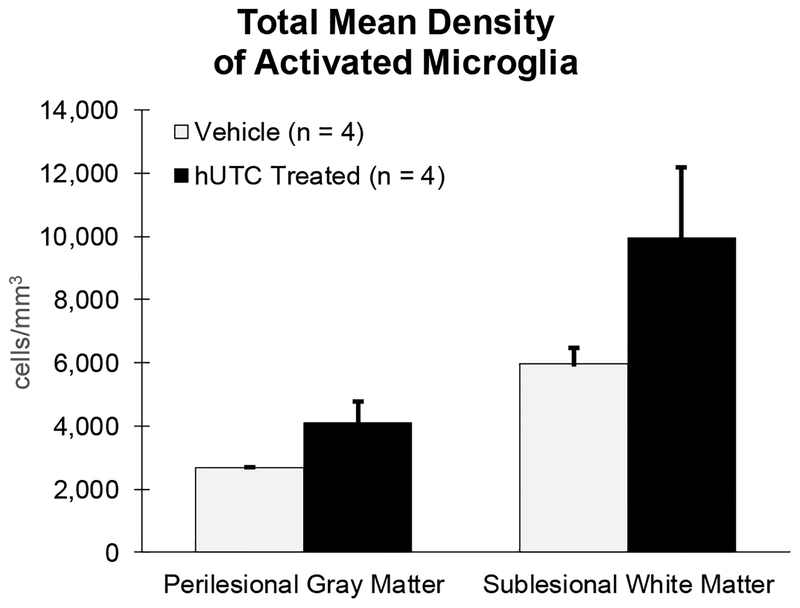
Figure 3: Density of MHC II Activated Microglia.
Density was determined by dividing the estimated cell count from unbiased stereology by the Cavalieri volume estimation. All numbers represent cells/mm3. Total density of activated microglia did not differ in the perilesional gray matter or sublesional white matter between treatment groups.

