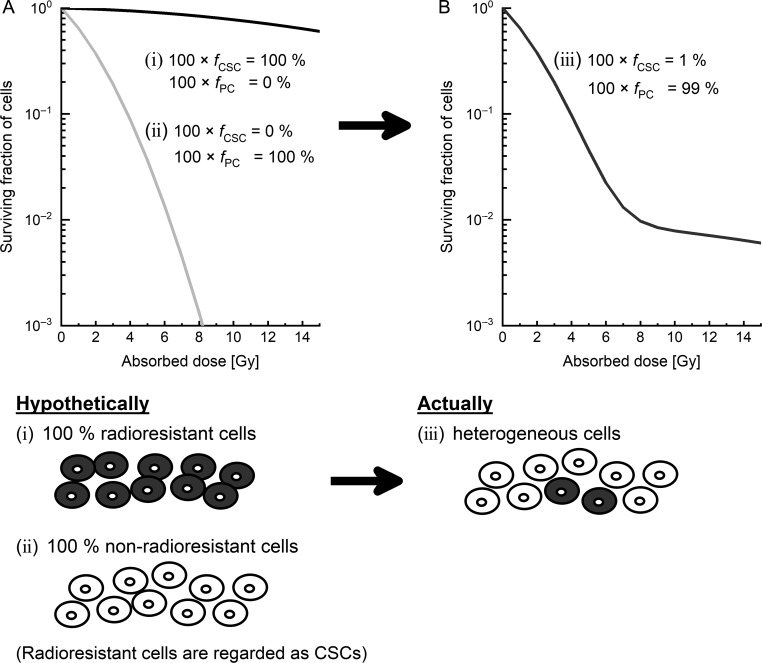
Fig. 1.
Schematic of the proposed model in this study. (A) The dose–response curve hypothetically dividing two types of cell populations from one type of cell line: (i) a group including only radioresistant cells, and (ii) another group consisting of only non-radioresistant cells. (B) The dose–response curve of actual heterogeneous cell lines (iii), which include 1% radioresistant cells. In this study, radioresistant cells were regarded as CSCs. CSCs: cancer stem cells.

