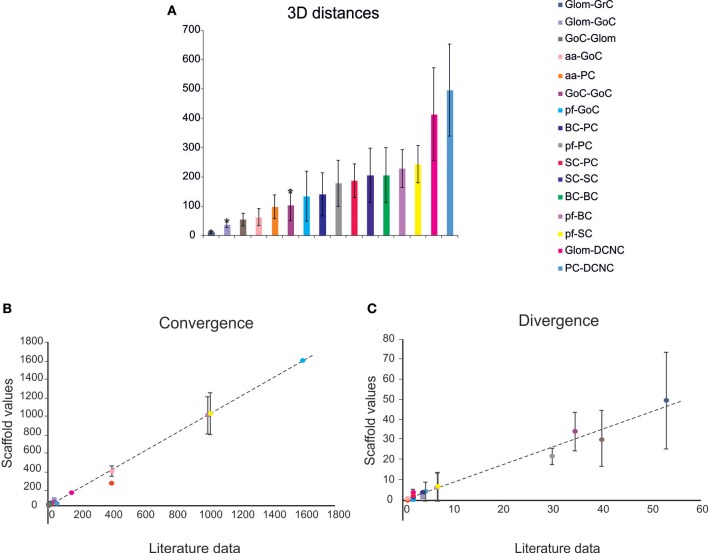
Figure 4.
Cell connectivity: pair-wise distance prediction and convergence/divergence validation. (A) Pair-wise distance prediction deriving from the placement and subsequent cell-to-cell connectivity. The data that find correspondence in literature are indicated as asterisks. For each connection type, the pair-wise distances between connected cells (inter-soma distance) are reported. Data from: (1) (D'Angelo et al., 2013), (2) (Barmack and Yakhnitsa, 2008), (3) (Rieubland et al., 2014). (B,C) The plots compare divergence and convergence for the different connections of the scaffold with those anticipated experimentally. The regression lines show a very close correspondence of the model to experimental results. Linear regression lines are fitted to the data (divergence: r2 = 0.98, slope = 0.88; convergence: r2 = 0.99, slope = 0.99). Data from: (1) (Nieus et al., 2006), (2) (Dieudonne, 1998), (3) (D'Angelo et al., 2013), (4) (Solinas et al., 2010), (5) (Kanichay and Silver, 2008), (6) (Cesana et al., 2013), (7) (Hull and Regehr, 2012), (8) (Lennon et al., 2014), (9) (Huang et al., 2006), (10) (Jorntell et al., 2010), (11) (Sultan and Heck, 2003), (12) (Person and Raman, 2012), (13) (Boele et al., 2013).

