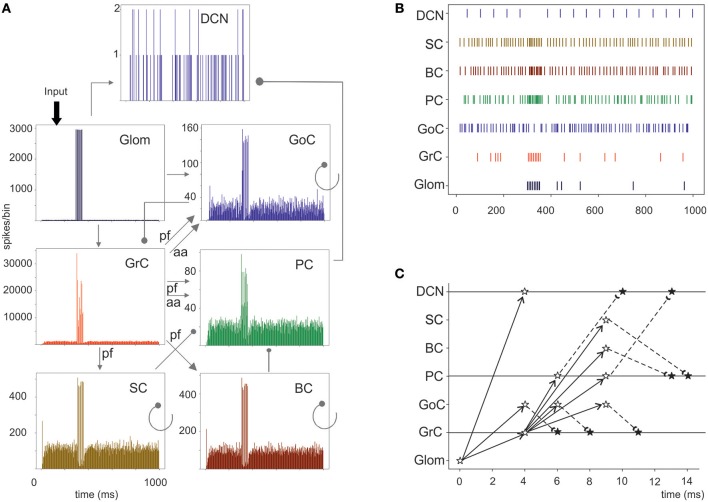
Figure 6.
Cerebellar network response to a mossy fiber burst. (A) Spikegrams of all cerebellar neurons in the model. A burst in gloms causes a burst-to-burst propagation in GrCs and PCs. GoCs, SCs, and BCs also generate bursts that, by being inhibitory, contribute to terminate the GrC, and PC bursts and to generate the burst-pause PC response. The DCN cells show a pause during stimulation. (B) Raster plot of one cerebellar neuron for each population in the model. Note the spread of the mf bursts inside the cerebellar cortical networks and the corresponding pause in the DCN. (C) Spike-time response plot showing the temporal sequence of neuronal activation and inhibition. The arrows represent the connectivity (solid lines show excitatory connections, dashed lines inhibitory connections). The stars represent the post-synaptic neuron response: white stars are excited neurons, black stars are inhibited neurons.

