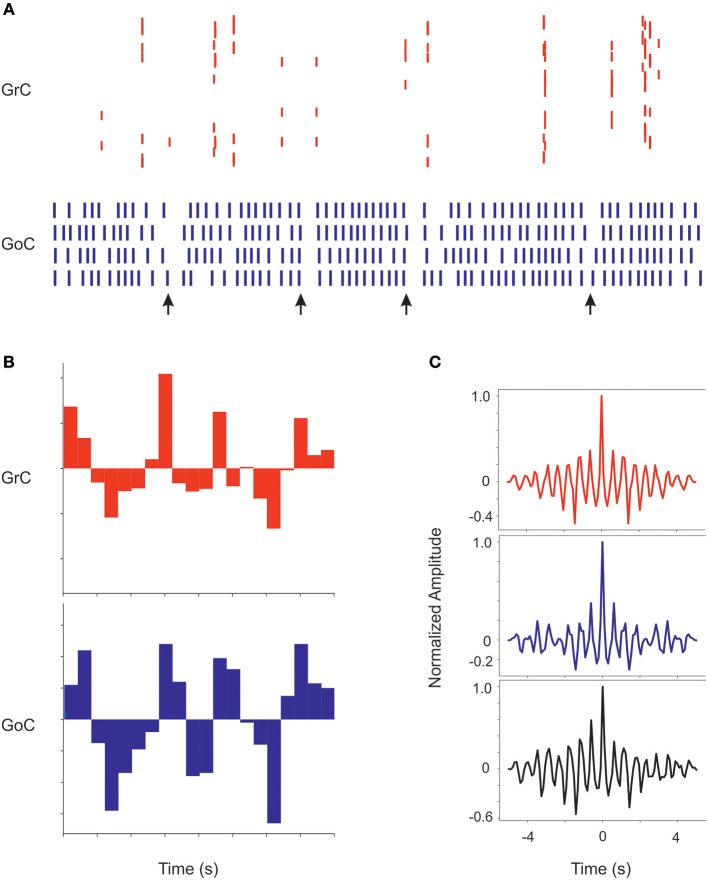
Figure 9.
Coherent low-frequency oscillations in granular layer neurons. Activity of GrCs (red) and GoCs (blue) during sustained 5 Hz random mf input. (A) Raster plots from exemplar GrCs and GoCs. Note that synchronous patterns are visible in the neuronal response (arrows). In this regimen, GoC activity is more intense than GrC activity due to the autorhytmic discharge of GoC neurons. The neurons are not necessarily part of a center-surround and therefore not all activities appear correlated. (B) Cumulative PSTH of the whole GrC and GoC populations of the model along a 5 s period. Note that the two PSTH show marked low-frequency oscillations (average 1.8 Hz) around their average level of activity. (C) Autocorrelograms of activity in the GrC and GoC populations and crosscorrelogram of the GrC and GoC populations (in this example the inhibition among GoCs is switched off). Note the high level of correlation in all the three cases on the same main frequency of 1.8 Hz.

