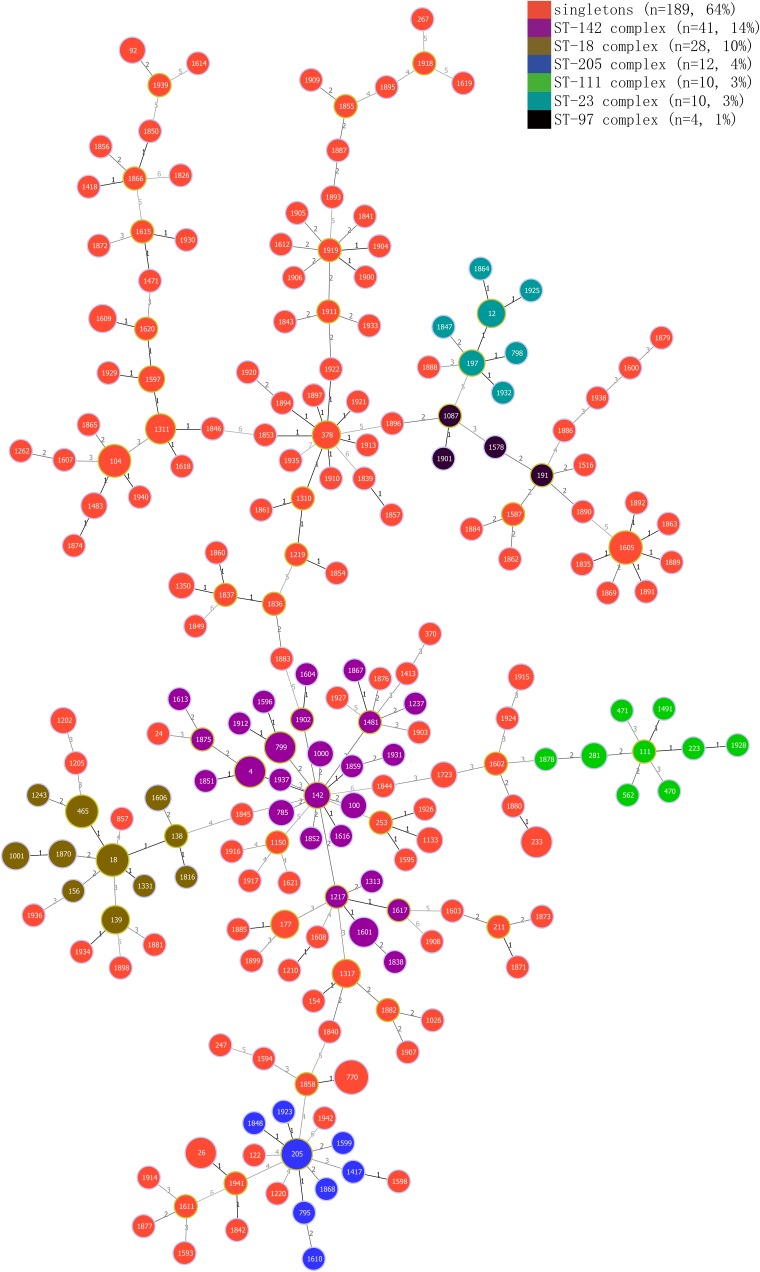
FIGURE 3.
Minimum spanning tree and genetic diversity of B. cereus from vegetables. Different colors inside the circles represent different clonal complexes and singletons. The numbers inside the circles represent the corresponding sequence types (STs). Gradation of the line color and the corresponding number along the line represent variation of the seven loci between two strains at both ends of the line. The dominant STs are represented by the circles with larger diameters.

