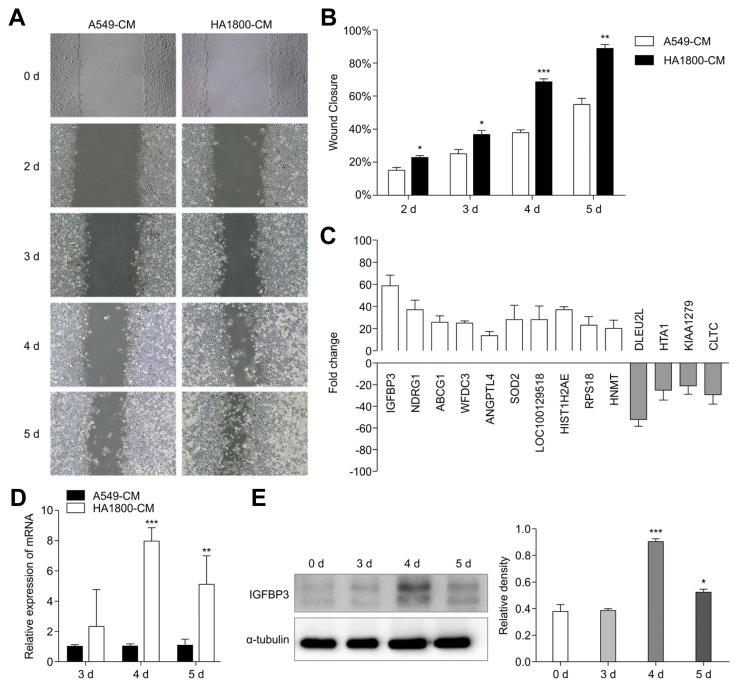
Fig. 1. HA1800-CM up-regulated IGFBP3 expression in A549 cells.
(A) The wound healing of A549 cells treated with A549-CM and HA1800-CM at different time points. (B) Wound closure of A549 cells treated with A549-CM and HA1800-CM at different time points. (C) Microarray analysis showed that IGFBP3 and other related molecules were up-regulated in the experimental group (HA1800-CM). (D) IGFBP3 mRNA expression was evaluated by qRT-PCR analysis. (E) IGFBP3 protein expression was detected by western blot, α-tubulin was used as the reference protein (left). The histograms represent the protein expression levels quantified by densitometry and normalized to α-tubulin (right). Data are presented as the mean ± S.E.M. (*p < 0.05, **p < 0.01, ***p < 0.001)

