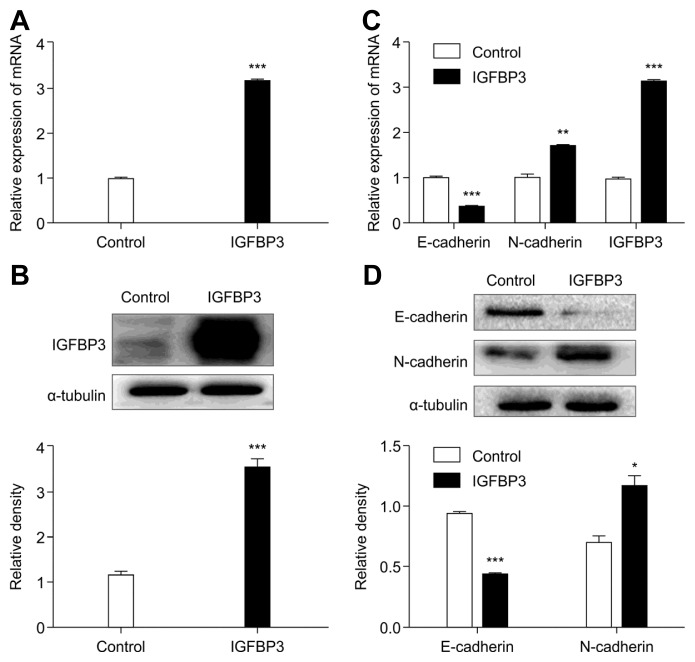
Fig. 2. Role of IGFBP3 in EMT of A549 cells.
(A) IGFBP3 mRNA and (B) protein expression were detected by qRT-PCR and western blotting, respectively, after transduction with IGFBP3. The histograms represent the protein expression levels quantified by densitometry and normalized to α-tubulin. (C) Detection of expression of EMT markers by qRT-PCR and (D) western blotting after overexpression of IGFBP3 in A549 cells. The histograms represent the protein expression levels quantified by densitometry and normalized to α-tubulin. Data are presented as the mean ± S.E.M. (*p < 0.05, **p < 0.01, ***p < 0.001)

