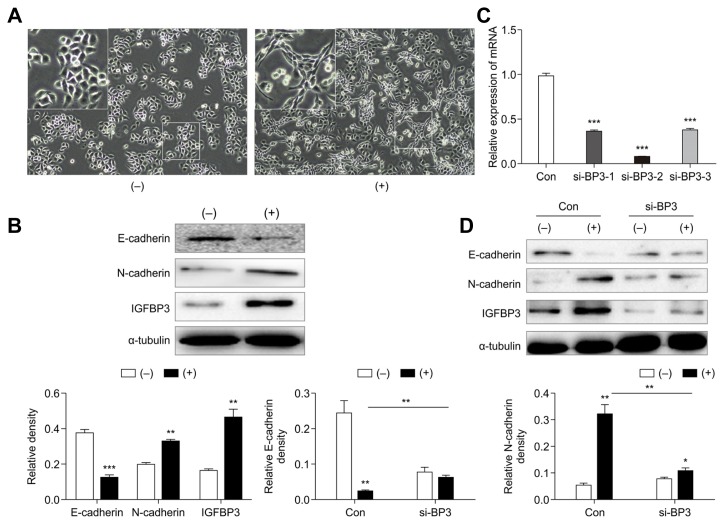
Fig. 3. IGFBP3 accumulation was required for the induction of EMT and cell motility in response to TGF-β.
(A) A549 cells were treated with TGF-β (5 ng/mL) for 48 h, and cell morphology changes were analyzed by bright-field microscopy (magnification, 100×). (−) indicates that TGF-β1 was not added. (+) indicates the addition of 5 ng/mL TGF-β1. The magnified area in (A) corresponds to the area highlighted by the white square. (B) Western blot analysis of epithelial-mesenchymal transition marker and IGFBP3 expression in response to TGF-β induction in A549 cells (above). The histograms represent the protein expression levels quantified by densitometry and normalized to α-tubulin (below). (C) The interference efficiencies of three distinct IGFBP3-targeting siRNAs (si-BP3-1, si-BP3-2, and si-BP3-3) were evaluated by qRT-PCR after transfection into A549 cells. β-actin was used to normalize for equal loading. (D) Western blotting of E-cadherin and N-cadherin in A549 cells transfected with the IGFBP3-specific si-RNA (2 d ± TGF-β treatment; above). The histograms represent the protein expression levels quantified by densitometry and normalized to α-tubulin (below). Data are presented as the mean ± S.E.M. (**p < 0.01, ***p < 0.001)

