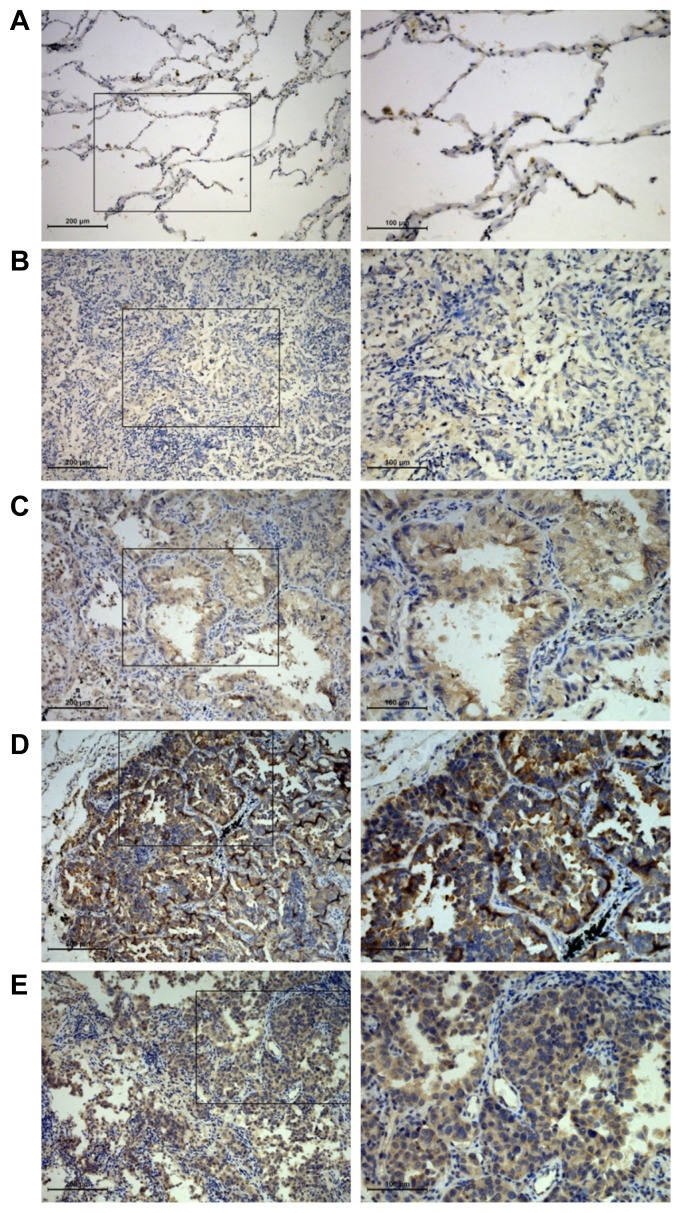
Fig. 6. Differential expression of IGFBP3 in lung and brain tissues of LUAD.
The representative fields of IGFBP3 expression in different groups by IHC were observed under light microscopy with 100× (left) and 200× (right) magnifications. (A) Normal lung tissues; (B) non-metastatic primary lesions; (C) other-metastatic primary lesions; (D) brain-metastatic primary lesions; (E) brain metastatic lesions. On the right column, magnifications of the areas demarcated by black squares on the left column are shown.

