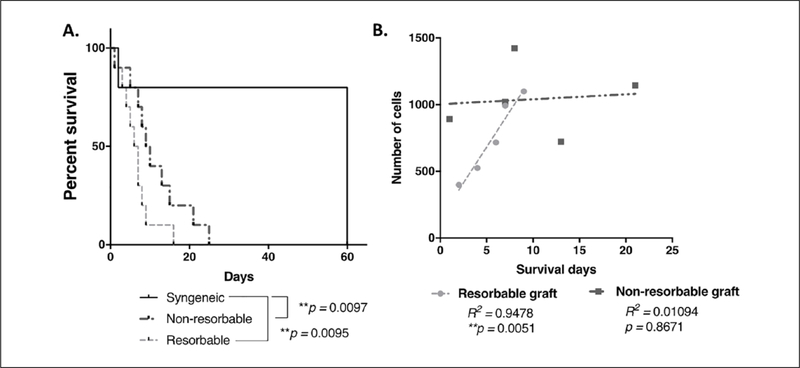
Figure 3.
Survival and cellular infiltration of syngeneic and synthetic tracheal implants. (A) Kaplan-Meier survival curve comparing animals which received resorbable and nonresorbable grafts to those with syngeneic transplants. Log rank (Mantel-Cox) testing revealed statistically significant differences between each biosynthetic scaffold and the syngeneic implant group (nonresorbable **P = .0097, resorbable **P = .0095). Differences between the survival curves for the biosynthetic approached but did not achieve statistical significance (P = .0691). (B) Scaffold cellular infiltration plotted against survival days for resorbable and nonresorbable grafts. Cellular infiltration was significantly correlated with survival in the resorbable cohort, and this relationship was linear (R2 = 0.9478, **P = .0051). This relationship was not observed in nonresorbable grafts (R2 = 0.01094, P = .8671).

