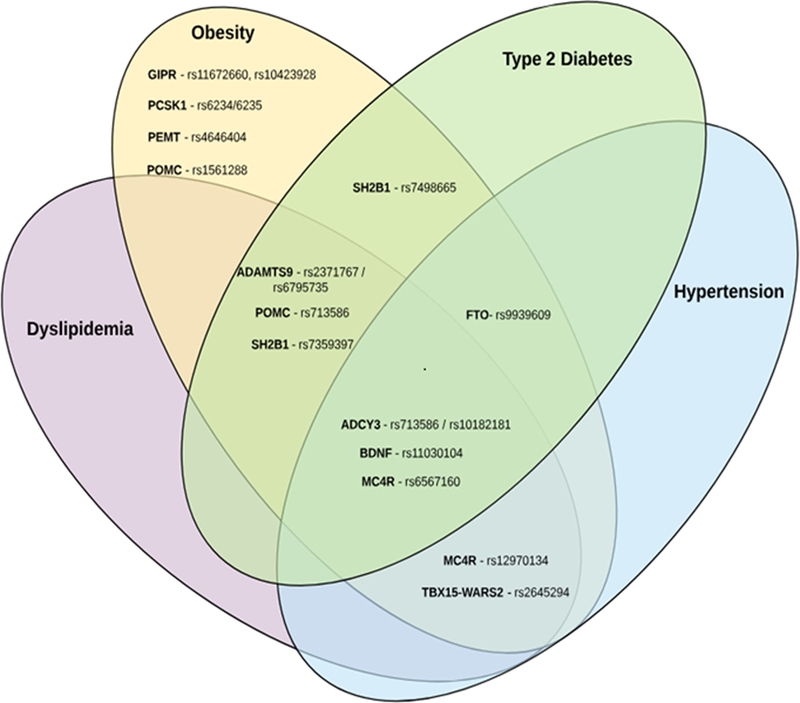
Figure 1.

Venn diagram showing the pleiotropic associations of common variants among the major obesity loci identified by GWAS. Genetic variants identified in the GWAS for obesity are classified based on the results of the pleiotropic association reported of the same loci/variants with other cardiovascular traits. Each cardiovascular trait shown in different colors in the Venn diagram (yellow, purple, green, aqua) corresponds to each of the cardiovascular traits (obesity, dyslipidemia, type 2 diabetes, and hypertension), respectively. Effect sizes and pleiotropic association p-values are summarized in Table 1.
