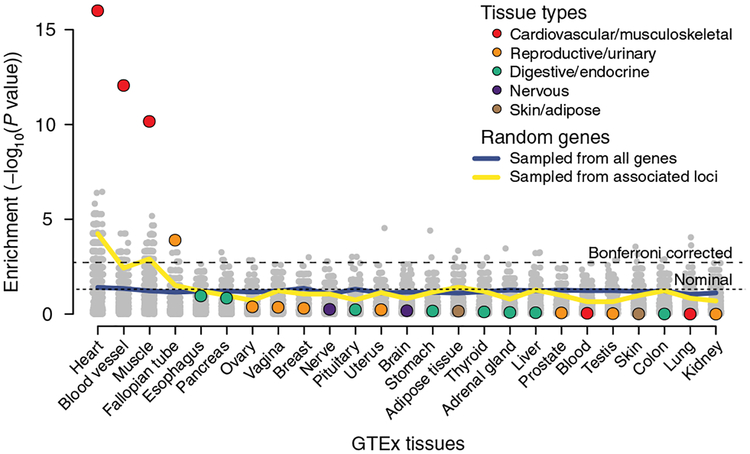
Fig. 3 |. Significance of the expression enrichment for the atrial fibrillation candidate genes.
This figure compares the tissue-specific gene expression enrichment for the 151 biological candidate genes (colored dots) to a null distribution derived by randomly selecting the same number of genes from the whole genome or from the associated loci. Tissue-specific gene expression data (n = 25 tissues) were obtained from Genotype-Tissue Expression (GTEx) consortium data. The gray dots represent the P values for each of the permutations for the randomized tests (1,000 for both sampling scenarios for each tissue), and the blue and yellow lines represent the per-tissue P value thresholds comparable to a false positive rate of 0.05.

