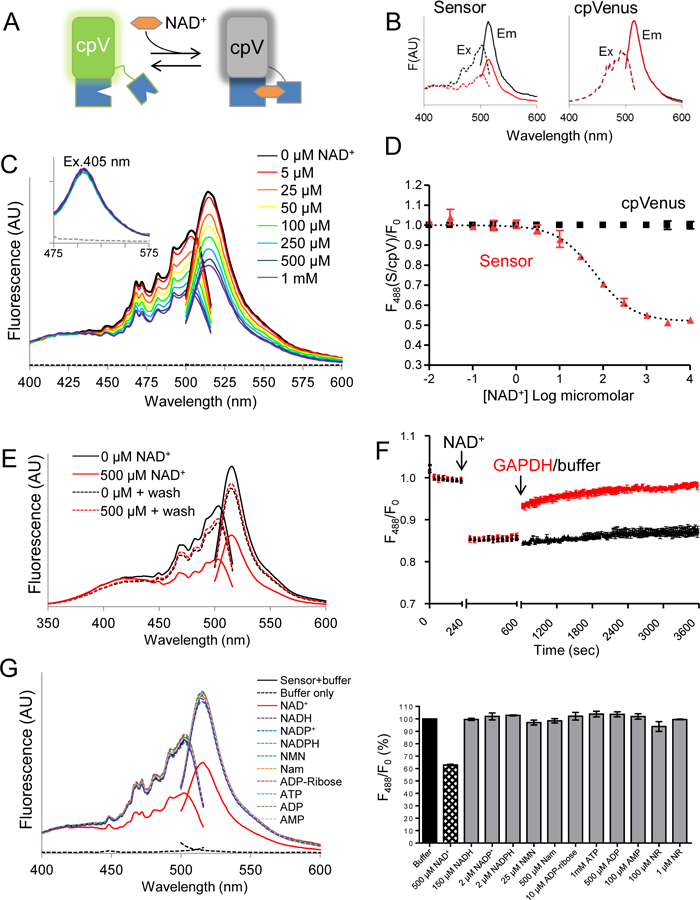
Fig. 1. Characterization of an NAD+ biosensor.

(A) The NAD+ biosensor comprises cpVenus (cpV) and a bipartite NAD+-binding domain (blue). The unbound species fluoresces following excitation at 488 nm; NAD+ binding causes a loss of fluorescence. (B) Excitation (dashed lines) and emission (solid lines) scans of purified sensor with either 0 µM (black) or 500 µM (red) NAD+. Excitation was monitored at 530 nm and emission was monitored after excitation at 488 nm. (C) Fluorescence emission and excitation scans at indicated NAD+ concentrations or buffer only control (dashed lines). Inset shows fluorescence from excitation at 405 nm. (D) Maxima from 488 nm emission peaks of sensor and cpVenus (250 nM) at indicated NAD+ concentrations; mean±SD, n=3. (E) Fluorescence excitation and emission of sensor incubated with 0 µM (black solid) or 500 µM NAD+ (red solid). NAD+ was washed out and fluorescence was re-evaluated in each sample (dotted lines). (F) GAPDH (red) increases sensor fluorescence monitored at 520 nm following excitation at 488 nm. (G) (left) Excitation and emission profiles and (right) maxima from 488 nm emission with indicated substrates. mean±SD, n=3.
