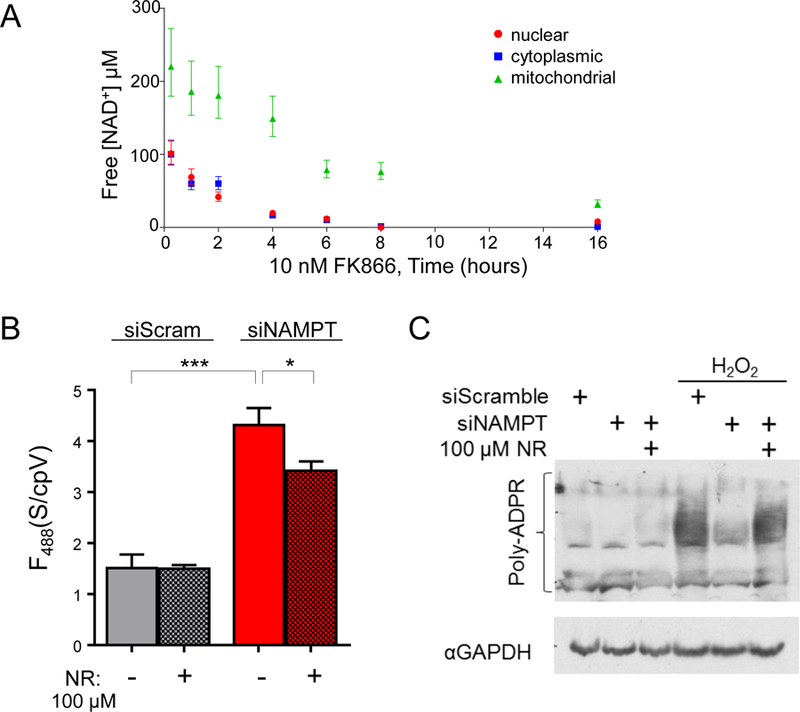
Fig. 3. NAD+ fluctuations in cells.

(A) Free NAD+ concentrations in HEK293T cells following treatment with FK866 (10 nM). Fluorescence of Sensor/cpVenus (488/405 nm) were measured by flow cytometry and the fold- change compared to untreated controls was interpolated onto an in vitro standard curve. (B) Cytoplasmic free NAD+ was decreased by NAMPT depletion and partially restored by NR treatment (100 µM). Imaging measurements from ex. 488 nm. REML, mean±SEM, n=3, ***p<0.001, *p<0.05. (C) Effect of free NAD+ availability on PARP activation.
