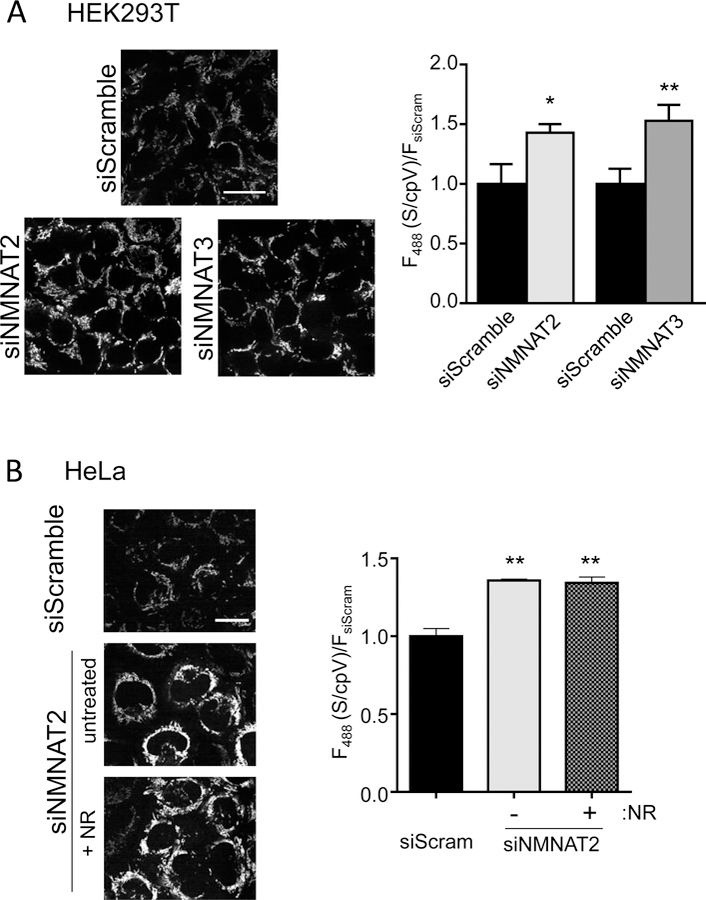
Fig. 4. Multiple sources for mitochondrial NAD+.

(A) Imaging measurements of mitochondrial NAD+ sensor after depletion of either NMNAT2 or NMNAT3 in HEK293T cells. Scale bar, 25 μm. Ex. 488 nm fluorescence was normalized to cpVenusMito. Mean±SEM, n=3, REML, *p=0.03, **p<0.005. (B) Effect of NR treatment (250 µM, 24 hours) on NAD+ levels in the mitochondria of HeLa cells depleted of NMNAT2. Representative images, left. Scale bar, 25 μm. Quantitation of fluorescence, right, relative to cpVenusMito and siScramble. Mean±SEM, n=3, REML, **p<0.01.
