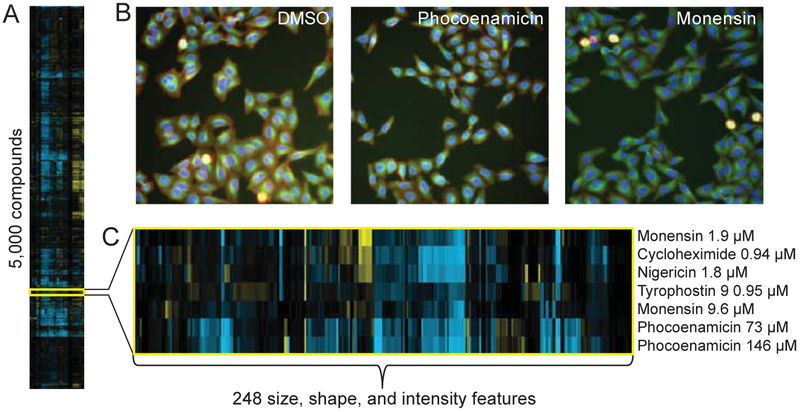
Fig. 5. Cytological profiling reveals clustering of phocoenamicin with ionophores.
(A) Hierarchical clustering of 5,000 compound treated wells evaluated against 248 cellular features. Positive and negative deviations relative to DMSO controls represented in yellow and blue, respectively. (B) Fluorescence images of drug-treated wells (phocoenamicin 146 μM, monensin 9.6 μM). Tubulin is represented in green, mitotic cells in cyan, actin in red, and DNA in blue. (C) Expanded fingerprints of phocoenamicin and neighboring cluster, which is enriched for ionophores.

