Fig. 3.

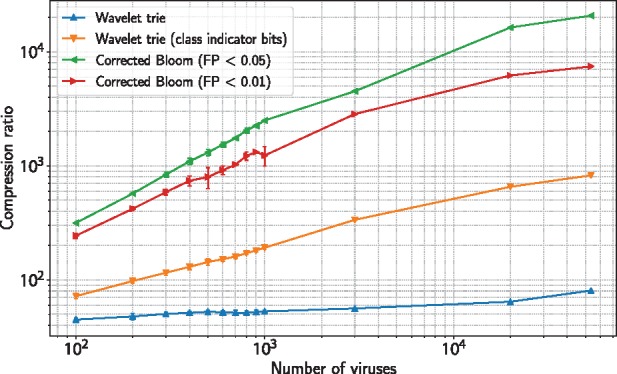
Growth of compression ratios. Compression ratios on virus graphs of increasing genome count. Error bars were computed from the virus graph chains resulting from six random draws of the Virus1000 dataset (see Section 3.2.1)

Growth of compression ratios. Compression ratios on virus graphs of increasing genome count. Error bars were computed from the virus graph chains resulting from six random draws of the Virus1000 dataset (see Section 3.2.1)