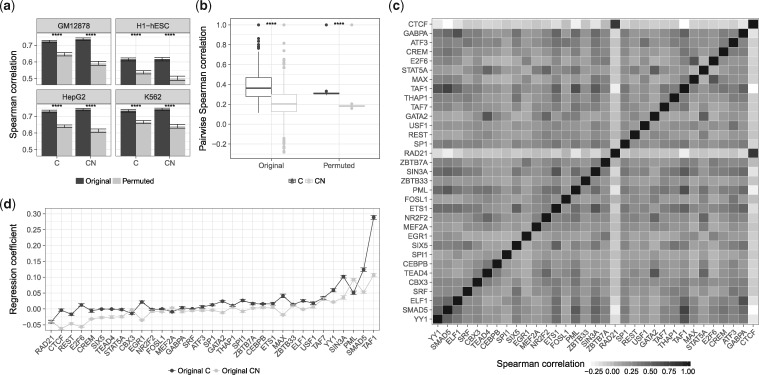
Fig. 3.
(a) Performance of a linear regression model predicting gene expression exploiting the original (C) scores is contrasted with the normalized (CN) ChIP-seq scores. (b) Pairwise Spearman correlation of TF-ChIP-seq gene scores computed for 33 TF-ChIP-seq assays in K562 for C and CN. (c) A heatmap of pairwise correlation values for CN scores. Regression coefficients learned for C, and CN scores are depicted in (d). Statistical significance in (a) and (b) is computed with a Wilcoxon test, where **** refers to a significance level of

