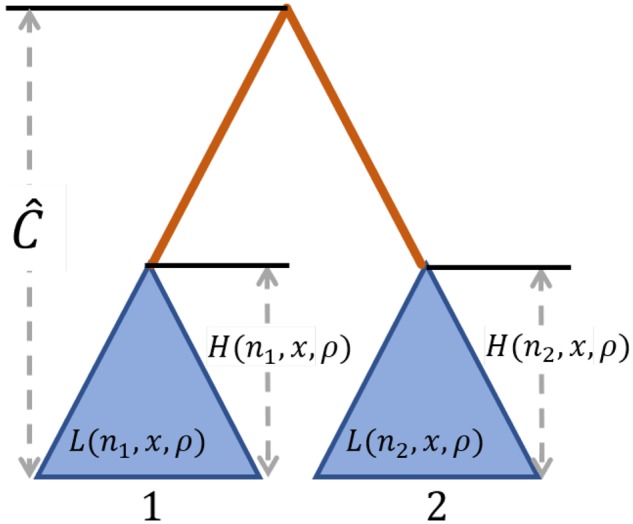
Fig. 1.

Schematic of the procedure for computing probabilities of polymorphism and substitution for a pair of species, under a model of long-term balancing selection. Blue triangles represent the subtrees of the neutral genealogy comprised all sampled lineages for each species, where within-species polymorphic sites are generated. The orange line, which has length , represents the length of the branch separating the two species, where substitutions are generated. denotes the estimated expected coalescence time between species 1 and 2. is the expected height of the subtree for a site with n alleles observed that is ρ population-scaled recombination units from a site undergoing long-term balancing selection and maintaining alleles at frequencies x and . is the expected length of this subtree.
