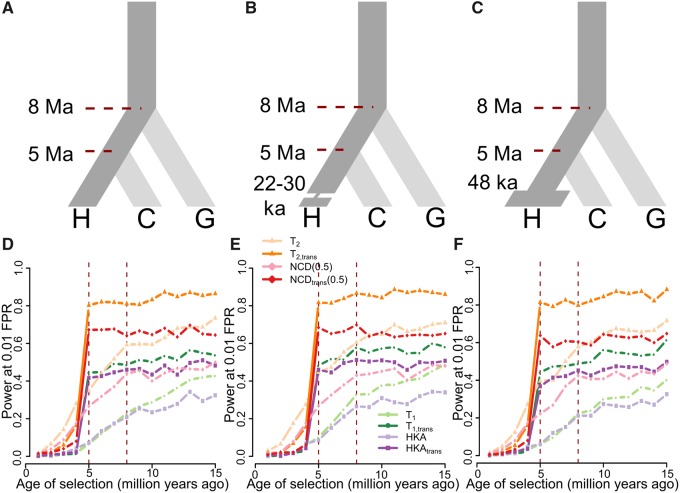
Fig. 2.
Performances of single- and trans-species variants of HKA, NCD(0.5), T1, and T2. (A–C) Schematic of demographic models relating three species, representing human (species H), chimpanzee (species C), and gorilla (species G), adopted in simulations. (A) All three species maintain constant population size of diploid individuals, with species H diverging from species C 5 million years ago (Ma), and the common ancestor of species H and C diverging from species G 8 Ma. (B) Species H went through a 400-generation population bottleneck with size Nb = 550 diploids 22–30 thousand years ago (ka). (C) Species H doubled its population size to diploids 48 ka. Simulations assumed a generation time of 20 years across the entire phylogeny. (D–F) Powers at a 1% FPR of single- and trans-species variants of HKA, NCD(0.5), T1, and T2 to detect balancing selection (s = 0.01 with h = 100) of varying age under (D) constant population size, (E) recent strong population bottleneck, and (F) recent population expansion scenarios. Red vertical dashed lines represent the times at which species H and C split, and at which species G split, respectively.

