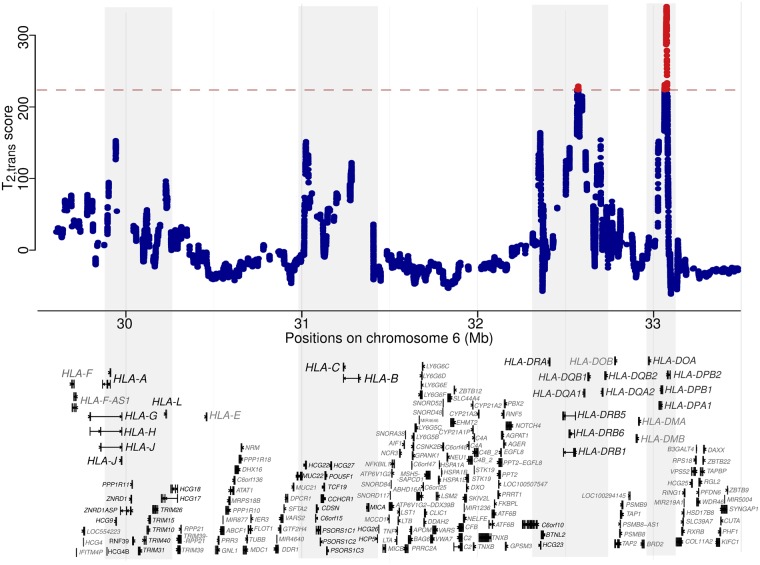
Fig. 3.
scores within the MHC region on chromosome 6. Gene tracks are displayed below, with only the longest transcript of each gene shown. If a gene does not have a longest transcript to cover all exons, then the minimum number of transcripts are displayed. Regions enriched with high-scoring peaks are shaded in gray, and genes falling in these areas are labeled with black fonts. The red dashed line represents the cutoff value for statistical significance, and the test sites with significant scores are shown in red.

