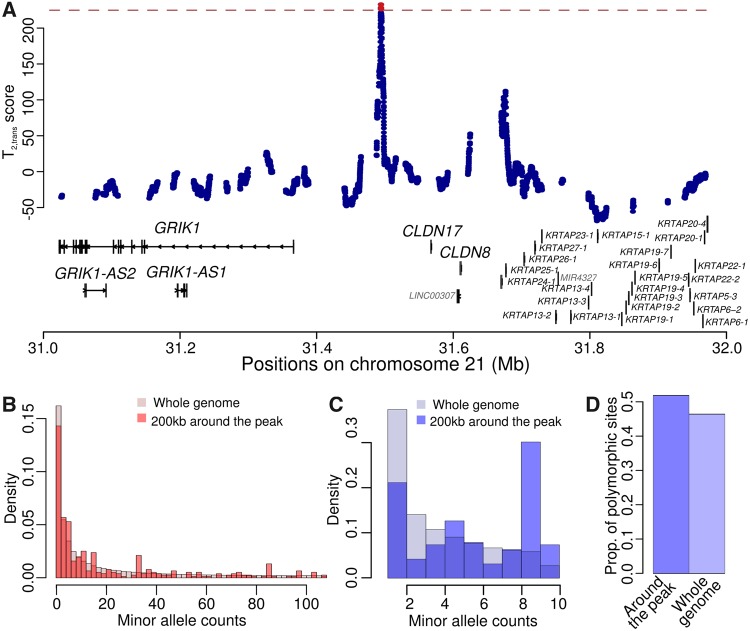
Fig. 4.
Patterns consistent with long-term balancing selection within the GRIK1/CLDN17 intergenic region. (A) scores within the 1-Mb genomic region on chromosome 21 encompassing the GRIK1/CLDN17 intergenic region. Gene tracks are shown on the corresponding location, with key genes labeled with larger fonts. The red dashed line represents the cutoff value for statistical significance, and the test sites with significant scores are shown in red. (B–D) Minor allele frequency spectra at polymorphic sites for human (B) and chimpanzee (C), and proportion of informative sites that are polymorphisms (D) within a 200-kb region encompassing the GRIK1/CLDN17 intergenic region, compared with those of the whole genome.

