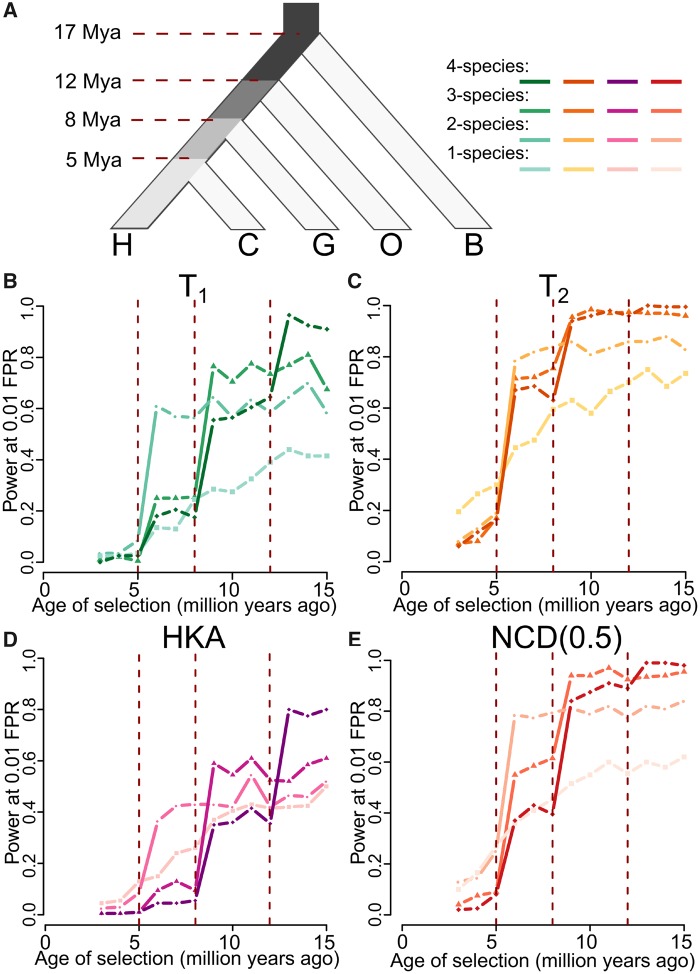
Fig. 5.
Performances of K-species variants of HKA, NCD(0.5), T1, and T2, with K = 1, 2, 3, or 4. (A) Schematic of the simulated five-species tree, relating species H, C, G, O, and B. Branches ancestral to species H are shaded based on the number of species that descend from that branch, with darker shades corresponding to larger numbers of species. (B–E) Powers at a 1% FPR of one-, two-, three-, or four-species variants for (B) T1, (C) T2, (D) HKA, and (E) NCD(0.5) to detect balancing selection (s = 0.01 with h = 100) of varying age. K-species variants of HKA, NCD(0.5), T1, and T2 with darker shaded lines are those that consider a greater number of species K.

