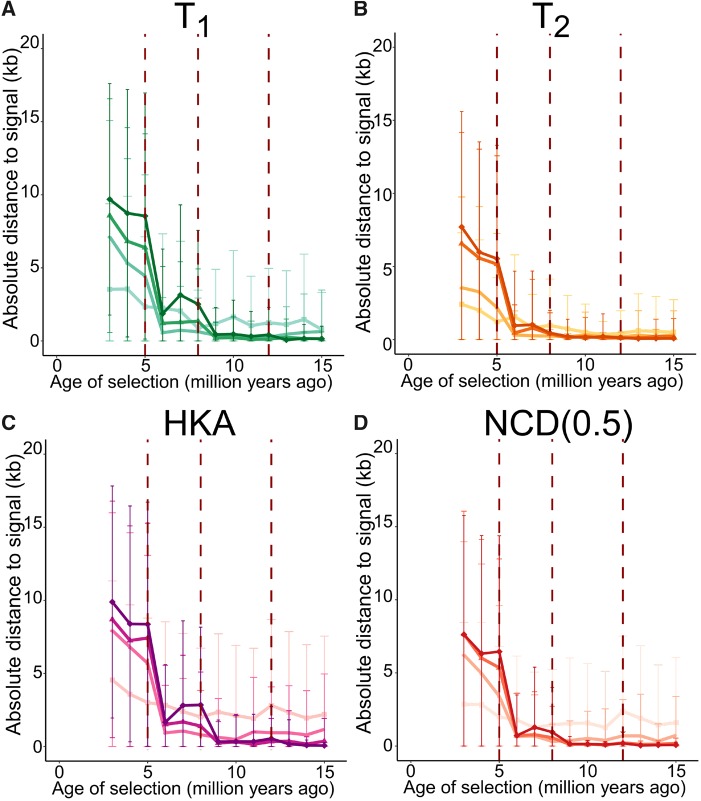
Fig. 6.
Mean absolute distances from location of signal peak to true site under balancing selection (s = 0.01 with h = 100) of varying age for K-species variants of (A) T1, (B) T2, (C) HKA, and (D) NCD(0.5). Error bars represent the standard deviation of all 200 replicates of the corresponding simulated scenario. Statistics are color-coded as in figure 5.

