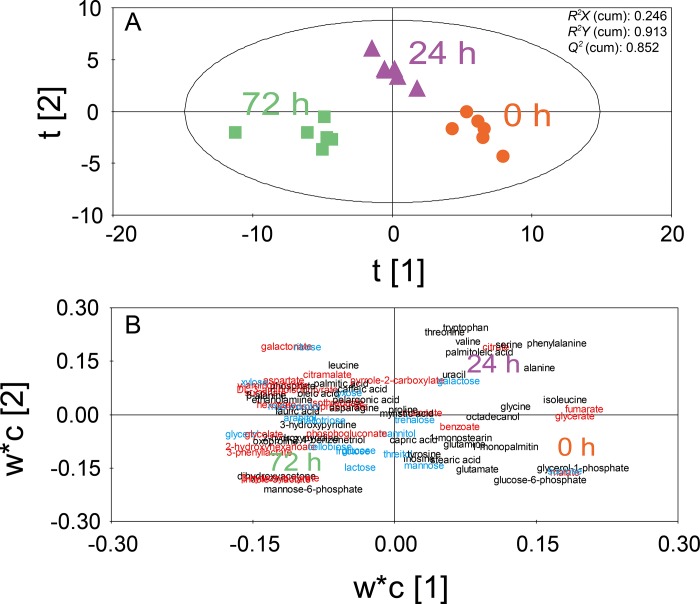
Fig 2. PLS-DA of 78 identified metabolites from mixed vegetables at 0 h, 24 h, and 72 h after inoculation of Lactobacillus plantarum.
PLS-DA score plot (A) and PLS-DA loading plot (B) are shown. Colors represent chemical classes of metabolites (red: organic acids; blue: sugars and sugar alcohols; black: others).

