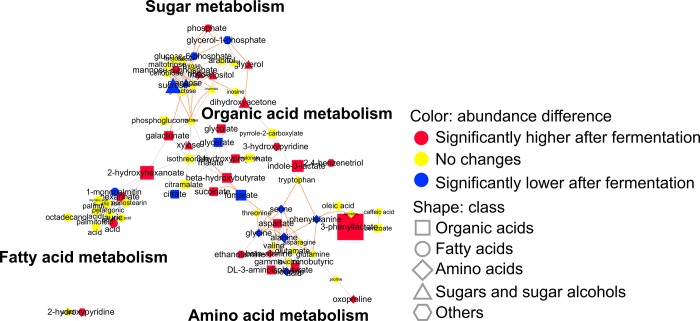
Fig 4. MetaMapp analysis for mapping 78 primary metabolites.
Classes of metabolites are represented by shape. Significant changes of metabolites are represented by color (p < 0.05). Magnitudes of fold changes are represented by sizes of symbols and labels. Biochemical and structural similarities are represented by purple and gray edges, respectively.

