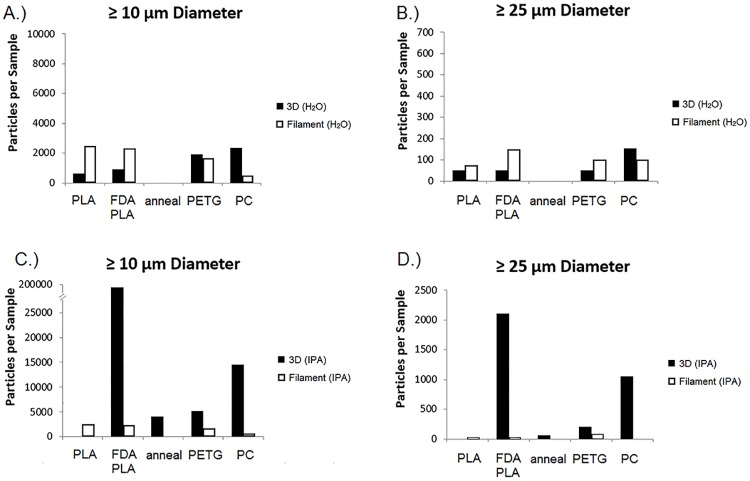
Fig 2. Particulate matter in extracts.
The number concentrations of particles observed in each material extract for each given size distribution (≥ 10 μm and ≥ 25 μm). 3D printed device extracts are represented in black while the filament extracts are represented in white. The water extracts for each size distribution are displayed in A.) and B.) while the IPA extracts are displayed in C.) and D.). Note that the annealed extract was only available for the finished printed device testing of the FDA PLA polymer.

