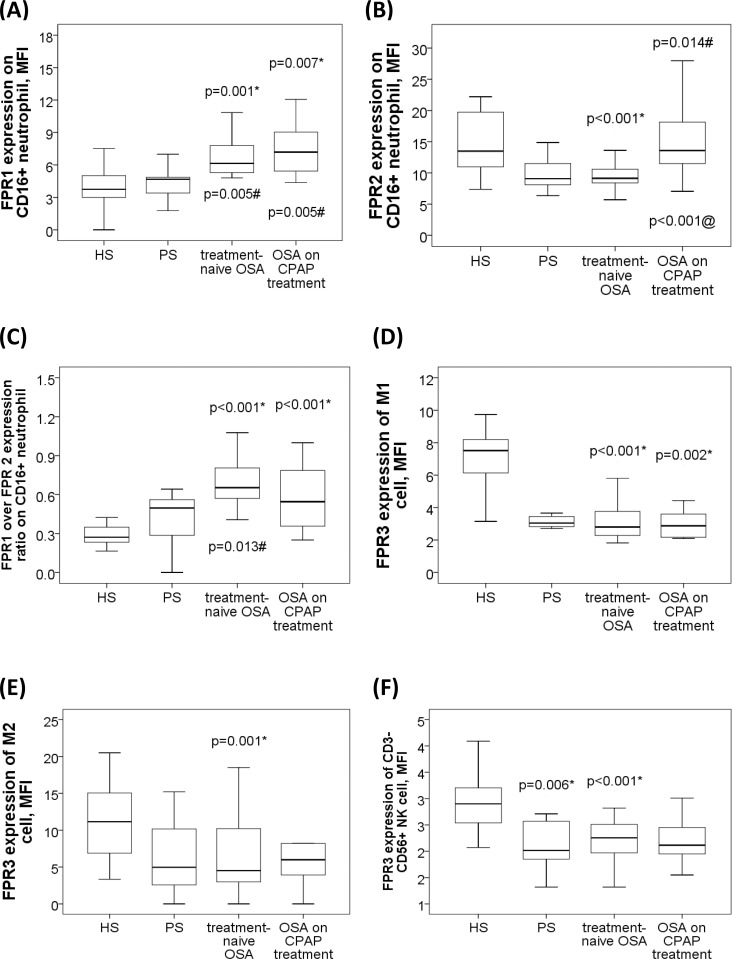
Fig 2. Formyl peptide receptor (FPR) 1/2/3 expressions of blood innate immune cells in patients with sleep disordered breathing and healthy subject without snoring.
(A) Increased FPR1 expression on neutrophil in patients with treatment-naive obstructive sleep apnea (OSA), and severe OSA under long-term CPAP treatment groups as compared with that in subjects with primary snoring (PS) and healthy subjects (HS). (B) Decreased FPR2 expression on neutrophil in treatment-naïve OSA group as compared with that in HS, and severe OSA on CPAP groups. (C) Increased FPR1/FPR2 expression ratio in treatment-naïve OSA and severe OSA on CPAP groups as compared with that in HS group. (D) Decreased FPR3 expression of M1 monocyte in treatment-naïve OSA and severe OSA on CPAP groups as compared with that in HS group. (E) Decreased FPR3 expression of M2a monocyte in treatment-naïve OSA versus HS group. (F) Decreased FPR3 expression of NK cell in PS, and treatment-naïve OSA, groups as compared with that in HS group. The box plots show the 25th, 50th, 75th percentiles, maximum, and minimum. *P<0.05 for comparisons between HS and another groups by Kruskal-Wallis test followed by post-hoc corrections and linear regression adjustments #p<0.05 for comparisons between PS and another groups by Kruskal-Wallis test followed by post-hoc corrections and linear regression adjustments @p<0.05 for comparisons between treatment-naïve OSA and severe OSA on CPAP groups by Kruskal-Wallis test followed by post-hoc corrections and linear regression adjustments.

