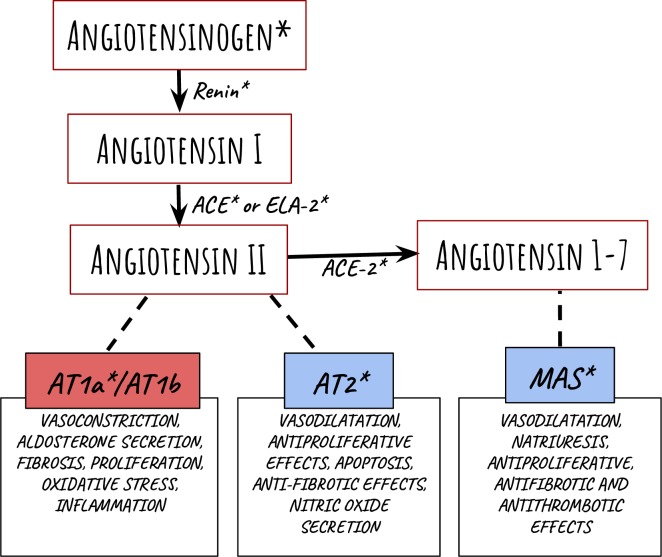
Fig 1. Representation of the metabolic RAS cascade.
Angiotensinogen and the peptide sequences are shown as a result of specific enzyme cleavages, which are included next to their represented arrows. The receptors are represented as boxes on the bottom and the function described is a result of the linked angiotensin binding. The RAS targets used in this study are indicated with an asterisk. Graphic illustration is adapted from Ferrario and Strawn [1].

