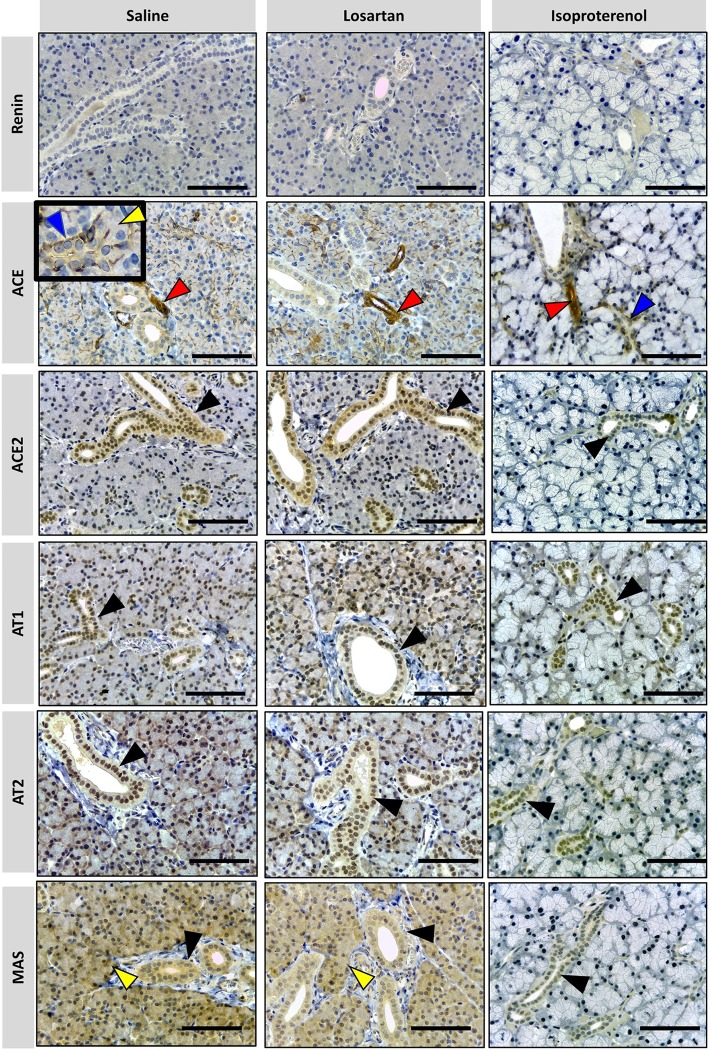
Fig 4. Photomicrographs of immunohistochemical staining (brown) of RAS targets in rat parotid gland.
Targets: REN, ACE, ACE-2, AT1, AT2 and MAS were analyzed. Arrows indicated by colors: blue = ducts; yellow = acini; red = blood vessels; black = epithelial cells of the duct system. No REN expression in parotid glands was observed under all treatments. ACE is present in myoepithelial cells around intercalated ducts (indicated by blue arrowhead in detail), acini (indicated by yellow arrowhead in detail) and in blood vessels (indicated by red arrowhead). ACE-2, AT1 and AT2 are present in epithelial cells of the duct system (indicated by black arrowhead), while MAS is present in duct cells (black arrowhead) and acinar cells (blue arrowhead) in all treatments except for isoproterenol. Comparatively, the parotid glands of the animals which received saline and losartan show a similar pattern of immunolabeling for RAS targets but have more expression than in animals which received isoproterenol. (x40 objective and scale bar = 50 μm).

