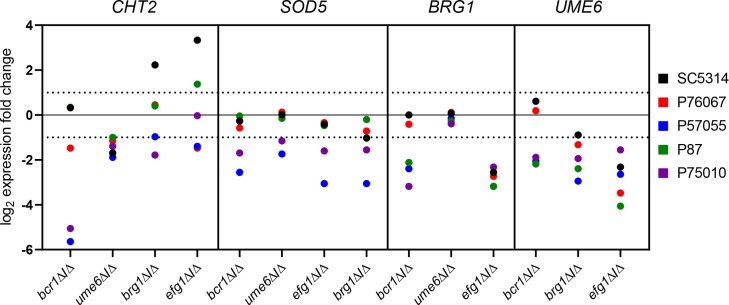
Fig 5. Range of TF mutant gene expression impact.
Fold-change values are plotted for RNAs from the CHT2, SOD5, BRG1, and UME6 genes in each TF mutant in all five strain backgrounds. Three biological replicates were analyzed using Nanostring for all strains. Data are extracted from S1 Table.

