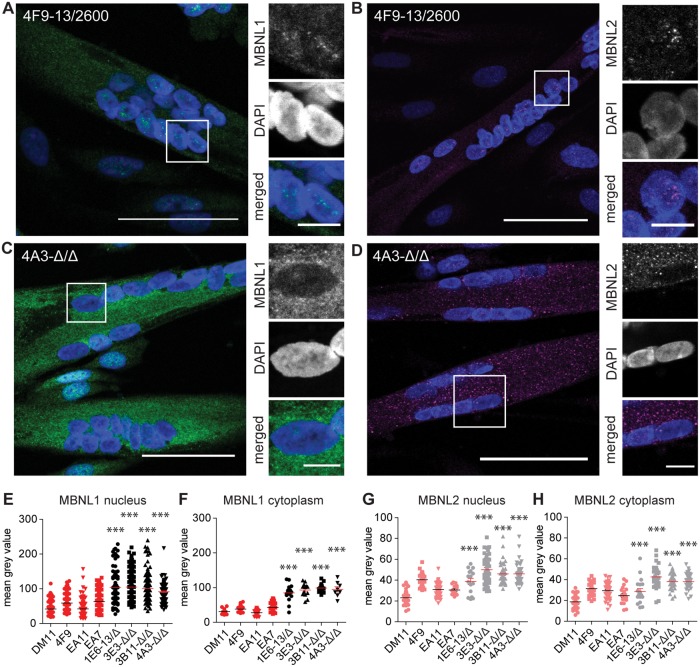
Fig 5. Subcellular distribution of MBNL1 and MBNL2 in five-day differentiated myotubes with and without (CTG)2600 repeat.
(A-D) Immunofluorescent localization of MBNL1 and MBNL2 in myotubes with (4F9) and without (4A3) the (CTG)2600 repeat expansion, after five days in differentiation medium. Images show DAPI in blue, MBNL1 in green and MBNL2 in magenta. Bars are 50 μm in large images and 10 μm in insets. (E-H) Quantification of MBNL1 and MBNL2 levels in the nucleus and the cytoplasm in all eight cell lines. Each symbol represents the average intensity in one multinucleated myotube.

