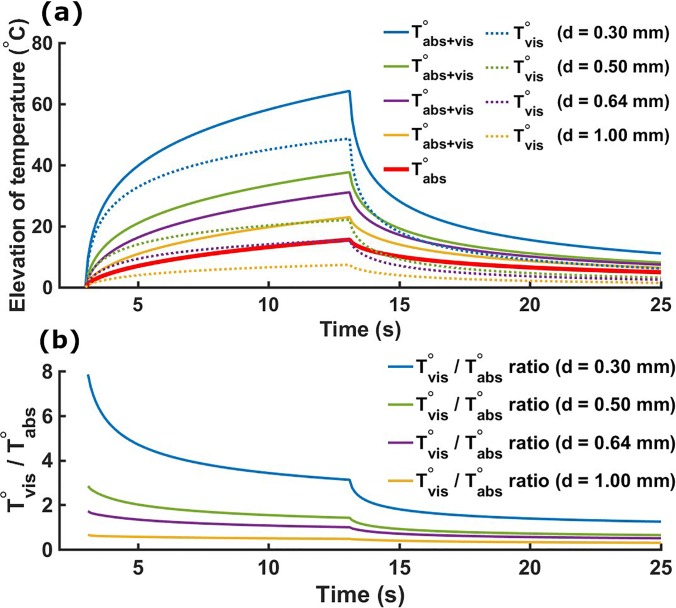
FIG. 2.
(a) Simulated temperature elevations using four different thermocouples (respective diameters d = 0.30 mm, d = 0.50 mm, d = 0.64 mm, and d = 1.00 mm). Solid lines present the temperature rise with both absorption and viscous heating (VH) inputs (Qabs and Qvis on). The solid red line presents the temperature rise with absorption only (Qabs on and Qvis off). Dashed lines present the viscous temperature rise obtained from subtracting the absorption only temperature elevation (solid red line) from the absorption and viscous heating (solid lines) temperature increases. (b) Simulated Tvis/Tabs ratios. This ratio is maximal after the start of sonication and decreases until its end (3 s < t < 13 s). A quick decrease in this ratio also appears at the beginning of the cooling period (t = 13 s).

