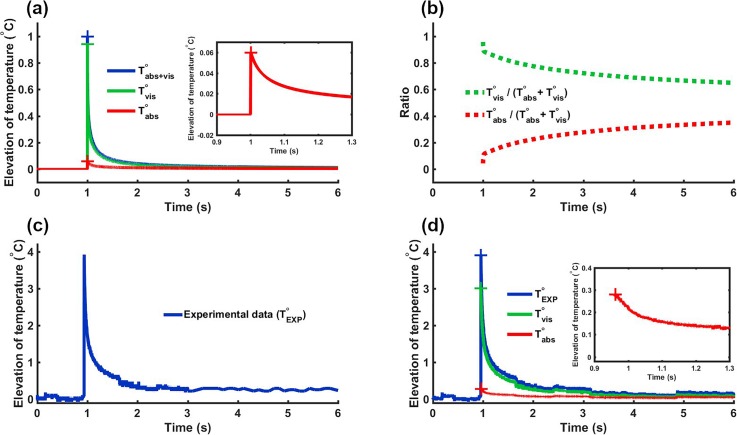
FIG. 3.
Presentation of the pipeline for experimental data correction. (a) Normalized simulated temperature elevations (sum of viscous and absorption) for a 1 ms single pulse. (b) Tvis/(Tabs + Tvis) (green) and Tabs/(Tabs + Tvis) (red) ratios computed from simulations of (a). (c) Experimental data to correct (1 ms pulse at 22 MPa). (d) Corrected data. Viscous and absorptive contributions to temperature elevation are obtained by multiplying raw experimental data by the ratios presented in (b).

