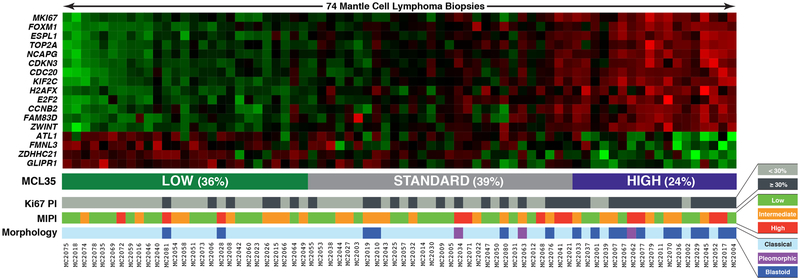
Figure 1.
Heatmap of RNA expression for the 35 genes included (rows) for the 74 individual biopsies included (columns). The total score indicate the three categories (low, standard, high). Underneath is depicted the corresponding Ki-67 score dichotomized into +/−30%, the MIPI score and whether the biopsies had a blastic or classical morphology type.

