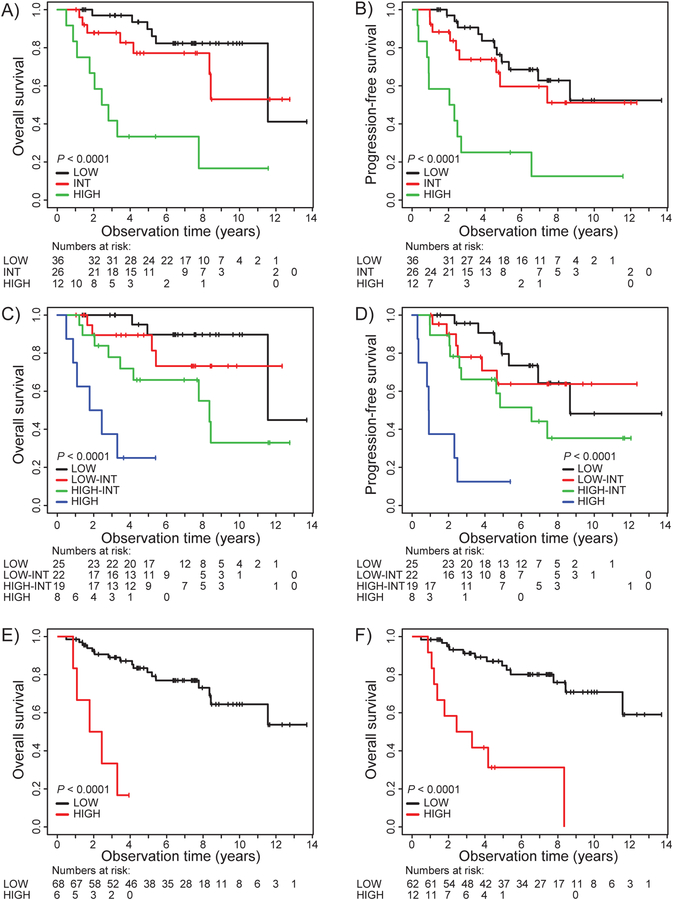
Figure 4.
Kaplan-Meier survival plots demonstrate stratification of MCL35 assay alone or in combination with MIPI or MIPI-C score. A. OS for MIPI risk groups. B. PFS for MIPI risk groups. C. OS for MIPI-C risk groups. D. PFS for MIPI-C risk groups. E. OS for MCL35 high risk combined with MIPI high risk versus others.. F. OS for MCL35 high risk combined with MIPI-C high/high-intermediate versus others.

